


Challenge
Catalyst Connection's green-energy program had its emissions math living in a rough Excel workbook. Their manufacturing clients needed it as a real application, one that turns workbook setup, facility details, activity data, calculations, and reporting into a guided flow a team can follow without becoming emissions-accounting specialists.
Approach
The Greenhouse Gas Protocol supplied the structure. The work was turning it into something a manufacturing team would actually follow.
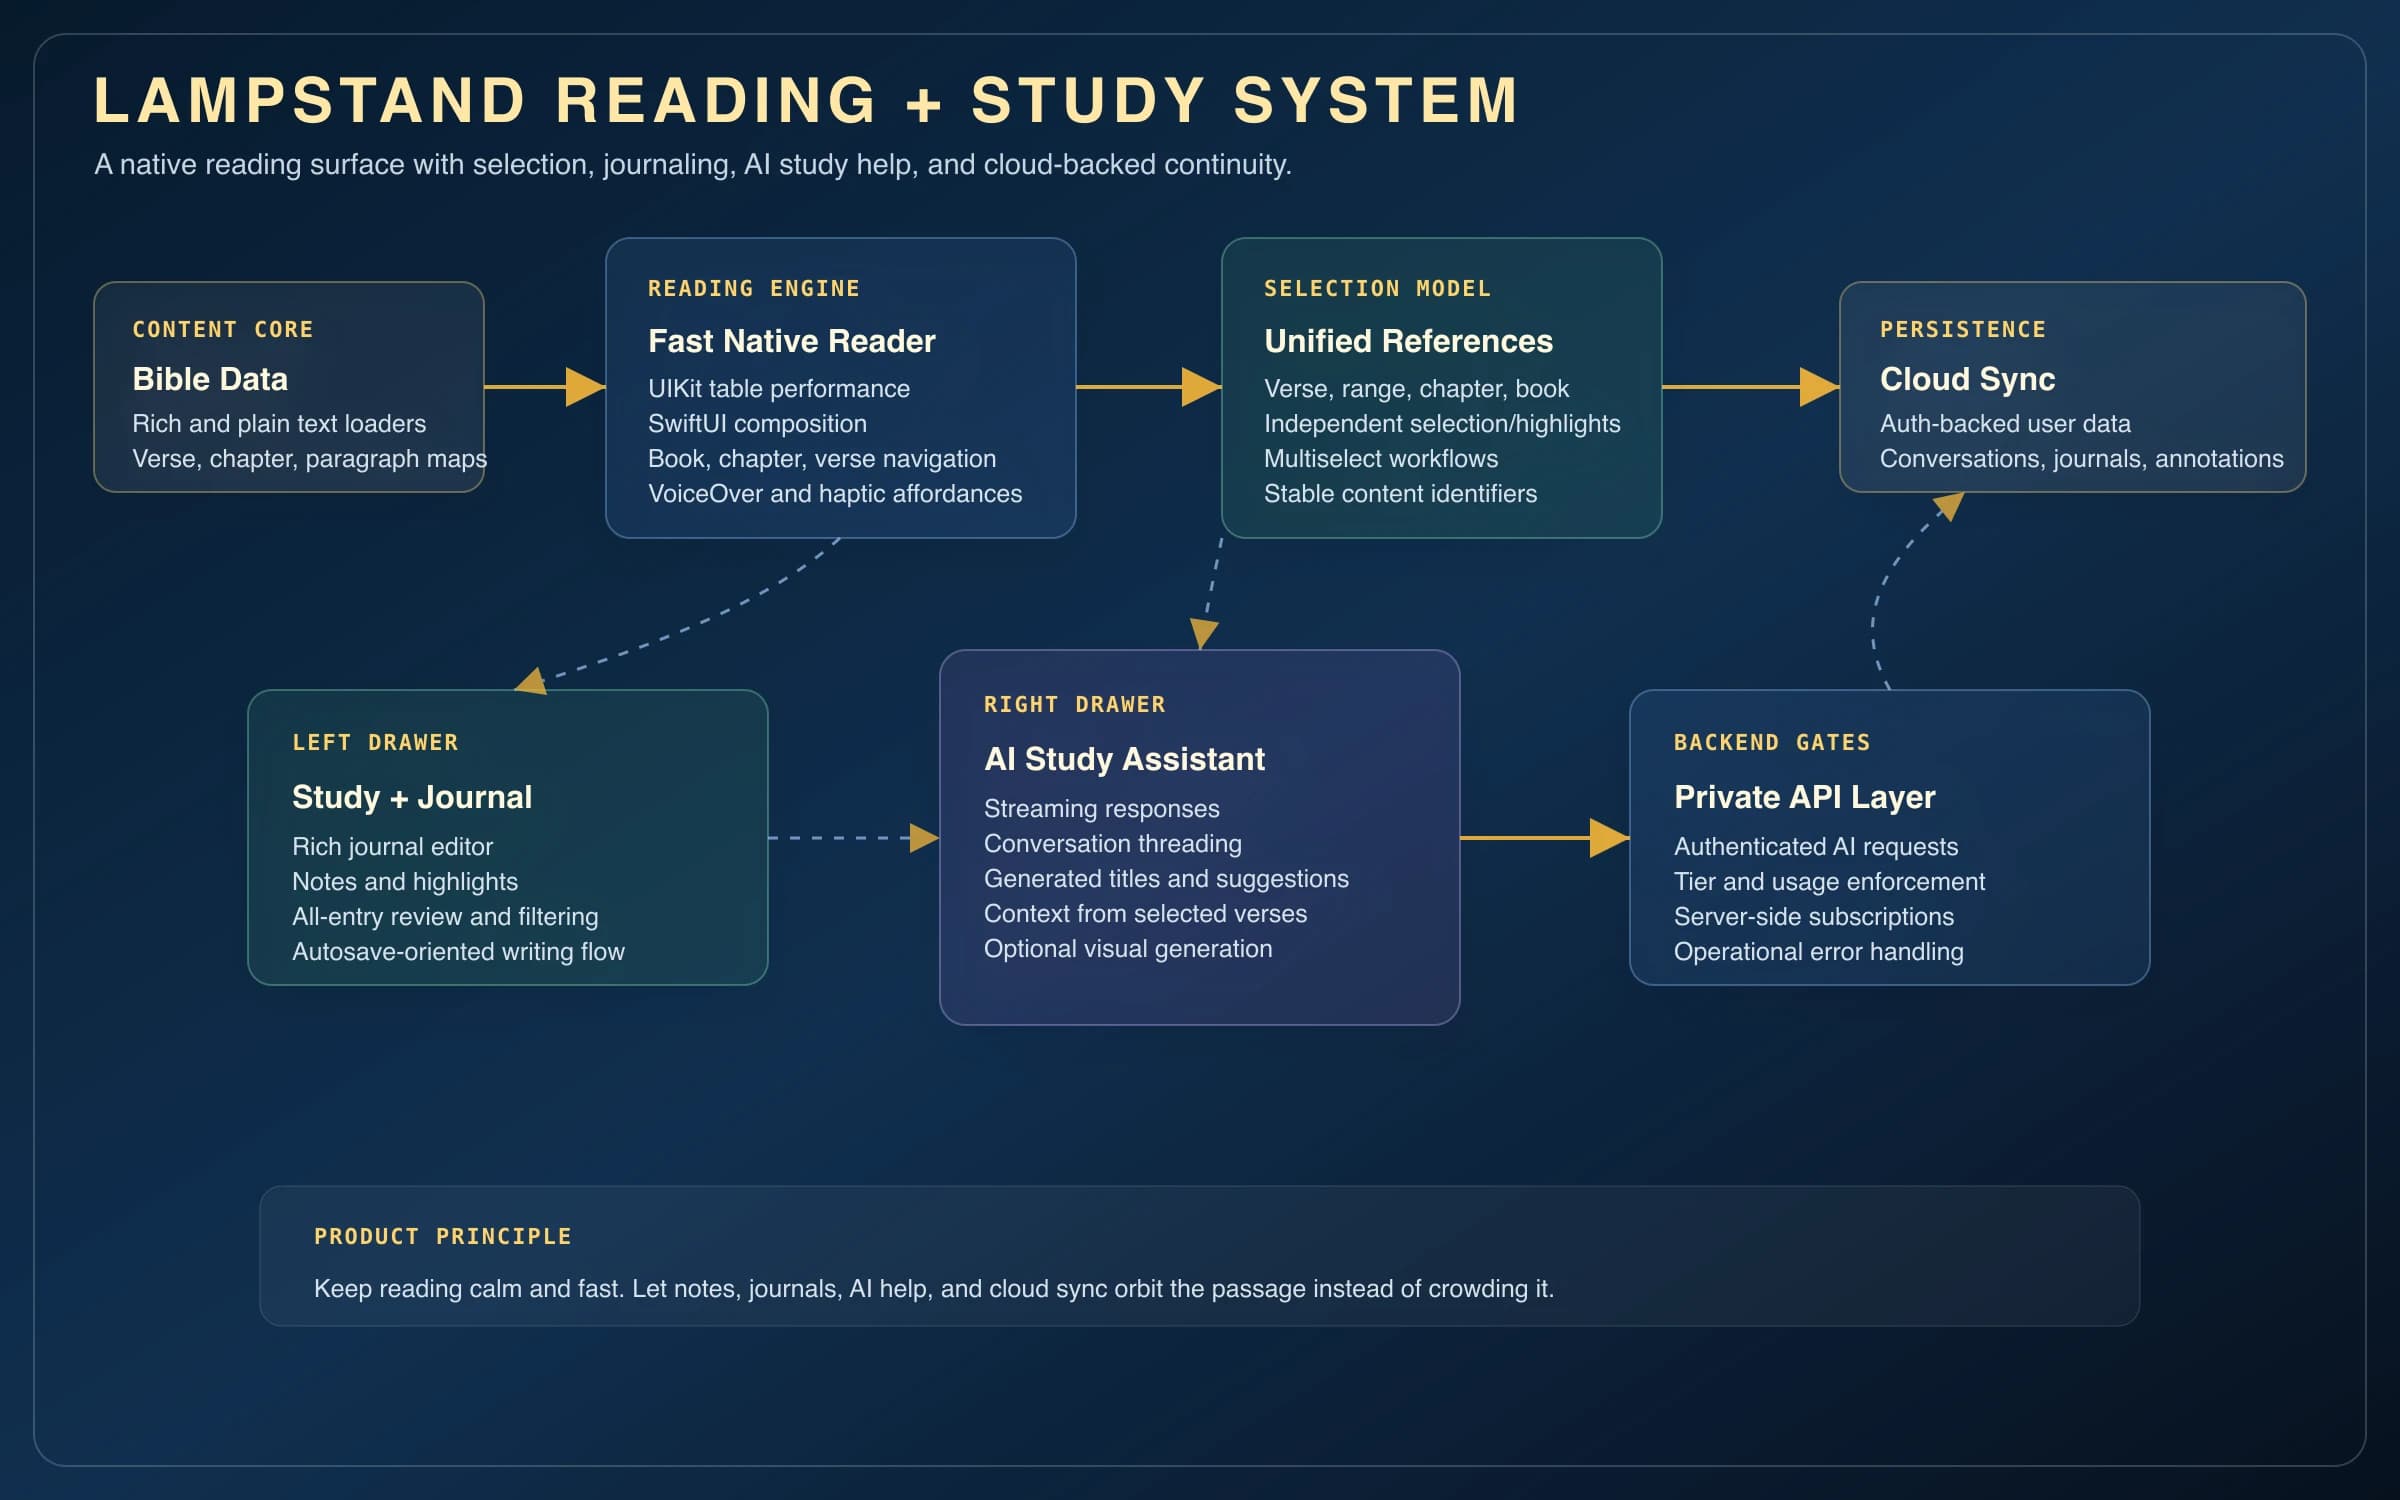
- Structured the product around the Greenhouse Gas Protocol workflow: company workbook, facilities, inventory years, Scope 1 activity, Scope 2 activity, calculations, and final report.
- Modeled facility and inventory-year setup first so later emissions entries can be grouped by manufacturing location, year, and operational context.
- Supported emissions categories for stationary combustion, mobile combustion, and purchased electricity, with calculated gas totals and CO2e rollups.
- Kept the portfolio version self-contained with seeded demo data so visitors can explore workbook setup and report output without credentials or a live backend.
Protocol into workflow
The core product problem was translating the Greenhouse Gas Protocol into a workflow that feels like a manufacturing workbook instead of a compliance spreadsheet. Each setup step gives later calculations enough context to group and explain the output.
- Company metadata and NAICS code establish the workbook.
- Facilities capture location, eGRID subregion, square footage, and notes.
- Inventory years create a baseline for year-over-year comparisons.
- Scope 1 and Scope 2 activity categories organize emissions inputs around how the work is actually reported.
Calculation model
The calculator keeps the public-facing workflow simple while preserving the emissions-accounting structure behind it. Activity rows can produce gas-level results, which then roll up by facility, year, and scope.
- Stationary combustion covers fuel usage for heat, steam, power, and process loads.
- Mobile combustion supports fleet activity by fuel or distance.
- Purchased electricity supports Scope 2 utility activity.
- Results include CO2, CH4, N2O, CO2e, biogenic CO2, and emissions intensity context.
Report output
The report view turns the calculator into something a manufacturing team can communicate. Instead of ending at raw rows, the product presents annual totals, gas charts, facility breakdowns, and export actions.
- Annual overview charts compare reporting years.
- Facility-level sections show where emissions are concentrated.
- PNG and PDF export actions make the report easier to share outside the app.
From client tool to public demo
The green-energy program behind the calculator was later canceled after federal funding changes, so the build now lives on as a public demo. It runs with a local workspace and seeded manufacturer data, which means visitors can explore the workbook flow and report output without credentials, live storage, or private customer records.